Brainwave Activity:

Types of Brainwaves and Stimulated Behaviors

Understanding Brain Mapping:

How to Interpret qEEG Maps and Track Trends

Types of Neurofeedback:

Single-Channel and 19-Channel

Operant Conditioning:

The Science Behind Neurofeedback

The 10/20 System

Electrode Placement

The Results:

The Final Product

Saturday, April 18, 2015

Identifying Disorders: ADHD

What is ADD/ADHD?

Attention Deficit Disorder is a neurological disorder which affects an individuals attention span, attentiveness, and ability to concentrate. People with ADD often find that focusing on tasks is very difficult, which can affect work/academic performance.

Symptoms:

1. Inattentiveness - Unable to focus on instructions
2. Hyperactivity - Unable to sit still, may seem very restless or fidgety
3. Short Attention Span - Unable to concentrate on tasks for a long period of time
4. Impulsiveness - Unable to control impulsive outbursts, emotions, or actions

ADHD in young children can often be mistaken for childish behavior, and may actually be late maturation. However, by age 5, most children have learned to sit quietly and respect instructions. At this stage, identifying ADD may be easier, as children affected by the disorder will still behave in a hyperactive/inattentive way.

What Causes ADD?

ADD is typically caused by irregular functioning of the frontal lobes, the executive action center of the brain. Abnormal blood flow to these regions, which correlate to certain brainmaps, cause behavioral problems. On the neural level: irregular electrical activity in the brain causes issues in the neurotransmission process: the proper amount of neurotransmitters are not fired across the synaptic gap. In ADD's case, the amount of dopamine (which is associated with sleep, mood, learning, and attention) is deficient. Medications that treat ADD force more dopamine to be produced to counteract the disorder. Acquisition of this disease is also hereditary. Children are very likely to get ADD if one or both parents have it.

Identifying ADD with Brainmaps

While brainmaps are not necessary for the identification of ADD, they can certainly be a helpful tool in both diagnosis and treatment. My internship adviser, Bob Gurney, participated in a research study with the creators of the NX Link Database (NYU Medical School). After analyzing the brainmaps of thousands of people with ADD, depression, obsessive compulsive disorder, etc., they created diagnosis tables containing the most common similarities between brainmaps of clients who had the same diseases. Each table contains subtypes, the most common different ways a disorder can manifest itself in the brainmaps. For example, ADD can be caused by both excessive Theta waves and Beta waves in the frontal lobes. On a brainmap, those two situations look completely different -- and yet, they result in the same disorder. These tables that were created became the NX Link discriminant database, which I described in the previous post. Clients brainwaves are compared against these norm tables for each disease, resulting in a very precise analysis/diagnosis. These tables have been tested in many countries on their native poplations, such as Japan, Nigeria, and Russia, and have proved their accuracy. Below are the subtypes for ADD, including a general symptoms list.

These are useful keys to identifying ADD in a map. If these signs are noticed, it is possible the patient has ADD.
a. New York University Medical School QEEG Normative Database Discriminant Analysis suggests the presence of Attention Deficit Hyperactivity Disorder (p<=0.025). This is merely the line printed on a QEEG if a patient is diagnosed with ADD with the NX Link.
b. Elevated frontal Theta, Alpha, and Beta (excessive Theta, Alpha, and Beta waves in the frontal lobes)
c. Reduced Delta (insufficient Delta waves in all regions of the brain)
d. Absence of expected ADHD Right frontal Theta and Alpha Asymmetry

Now these are the visual subtypes.
Normal Brain
This is what a completely normal brain with absolutely no problems should look like on the brainmap (0 standard deviations). While this is impossible, it gives the database a norm. 

Elevated Beta Subtype of ADD/ADHD
According to the key on the right, this patient has 3 standard deviations of Beta waves above the norm. As mentioned before,the fast Beta waves are produced when focusing on tasks or when concentration is necessary. However, too much blood flow, like above, can overclock the brain, causing a short attention span.

Elevated Theta Subtype of ADD/ADHD
ADD can also manifest itself in this subtype. The patient above has excessive Theta waves in the frontal regions (low blood flow there). The frontal lobes are in charge of completing tasks, executive action, and decisiveness. The excessive slow Theta waves (which are associated with drowsiness) cause sluggishness. This results in difficulty when focusing, and inattentiveness. Children with this subtype often can't pay attention because Theta is associated with daydreaming and relaxation. 

Elevated Alpha Subtype of ADD/ADHD
This patient has excessive Alpha waves in their frontal lobes. Alpha waves are the resting frequency of the brain. Imagine pulling up your car to a red light. The resting frequency of the car is analogous to the Alpha waves of the brain. If the resting frequency is too great, the brain will be working in overdrive -- the patient will tend to be more restless. This can also be a form of ADD. 


Identifying Disorders: Introduction

To identify many neurological problems and diseases, doctors and psychologists often use a type of brain-mapping system. Before demonstrating how brainmaps can help professionals, I will give you an overview of all types of neural imaging. This is the first post of "Identifying Disorders," in which I will demonstrate how neural imaging can identify various disorders. There are two specific types of brain mapping: structural and functional

Structural mapping can include MRI's, Cranial Ct Scans, etc. These maps show the structure of bones in the skull and surface of the brain. They are extremely useful when trying to identify structural problems, such as a skull fracture, brain tissue damage, etc. However, they give no insight into the actual functioning of the brain, so are not much help when identifying purely neurological problems.
MRI which shows the structure of the brain.
Functional mapping is very different. While it may not help identify structural problems, this form of imaging identifies issues with the way the brain is operating. A brain may be structurally sound, but could be operating differently from the normal. The two most popular types of functional mapping are SPECT scans and QEEG maps.

SPECT scans are nuclear image tests. Radioactive materials are injected into the patient's blood stream, and blood flow throughout the body is analyzed. This creates a color coded 3-D image of the region in question, allowing doctors to see where blood flow is irregular. SPECT scans are used for all parts of the body, however, in the brain, they can be as effective as QEEG maps. The blood flow in different parts of the brain give insight into whether that region is functioning properly or not. Irregular blood flow could indicate disorders or damage.
SPECT scan showing levels of blood flow
Analyzing SPECT scans (activity = blood flow)
Insufficient/Excessive blood flow to areas of the brain can cause performance problems in an individual. For example, excessive blood flow to the frontal lobes may cause hyperactivity and impulsiveness, while insufficient blood flow may cause inattentiveness and sluggish decisiveness.

QEEG maps are the images to which I have been referring to throughout my project. This method measures brainwave activity to identify problems. For an example of a QEEG, please see my previous posts.

Brainwaves and blood flow are actually very closely related. More fast wave activity in a certain region of the brain causes more blood flow. More slow wave activity causes less blood flow to that region. To make it simpler to understand in later posts, I have created a set of rules.

Fast waves: Beta
Resting frequency waves: Alpha
Slow Waves: Theta, Delta

Increased Beta / Decreased Beta = More blood flow / Less blood flow
Increased Alpha / Decreased Alpha = blood flow / blood flow
Increased Theta / Decreased Theta = Less blood flow / More blood flow.

So actually, the two types of brainmaps can be used together to create an even more accurate report. However, very few patients choose this route, as it is very pricey. So if SPECT scans can identify so many problems, why aren't they a popular method of disorder treatment? Firstly, they only identify the problems. SPECT scans only are used for diagnosis and offer no paired form of treatment. Secondly, they use radiation to measure blood flow, so health risks are abundant, especially in children, the elderly, and pregnant women. QEEG reports measure the various brainwaves, so they can be used in accordance with neurofeedback therapy treatment. In addition they are significantly less expensive ($400- $600) than SPECT scans ($1,200).  But I will also be referring to blood flow in the next posts, as it is an important concept to understand how disorders affect the brain.

Thursday, April 16, 2015

Neurofeedback Databases: NX Link

I realize that I haven't been posting for the last three weeks. I was busy with college decisions and deciding which college to attend. But with that decided, I will once again post regularly.

In an earlier post, I explained the uses of the Neurorep database, and how I create maps using its saved files. However, Scottsdale Neurofeedback Institute's most heavily weighted database is the NX Link Database, created by New York University's Medical School.

Creating the Brainmaps

First, I the patient's raw EEG file is imported into the host computer folder. These files (for both Eyes Open training and Eyes closed) contain the patient's amplified brainwaves. Then topographic tables are normalized -- in other words, the brainmaps/keys are labeled in a select way. Each brainmap is color coded, each color depicting a level of standard deviation from the norm. Examples will be explained later in this post. Then, the maps and brainwave files are printed and combined into a single file, the most important of which is depicted below.
 
The brainmaps are separated into columns and rows: the columns are the different brainwaves, and the rows each display the EEG information in a different way. 
 
Absolute Power: (Row 1 above) This row compares the patient's EEG to a database of normal brains, comparing each brainwave to z-scored norms. For example, the patient's Theta waves are compared to normal levels of Theta waves for an individual of their sex, handedness, and age.

Relative Power: (Row 2 above) This row compares the patient's EEG to a database of normal brains, comparing the relative levels between all the brainwaves to the relative levels of the z-scored norms. For example, a patient's Theta levels might be high compared to the norm, but their Theta/Beta ratio could be normal. This would balance out the behavioral side effects that merely excessive Theta would cause.

Power Asymmetry:/Coherence (Rows 3 & 4 above) This row compares how much the brainwaves in each hemisphere compare to those of the other hemisphere. If there is a significant deviation, it could indicate communication problems between the different parts of the brain. The electricity flowing between those regions might be irregular, and, as a result, could help identify larger neurological problems. Coherence measures how fast the regions of the brain communicate with each other. If the brain's electricity is sluggish, or even over-connected, it could indicate a form of brain damage/traumatic brain injury.

Each different interpretation of the brainwaves gives the doctor a better understanding of each individual's unique situation. Just one interpretation is not enough to diagnose, as only multiple montages could produce a relatively accurate diagnosis. 

Discriminants

Although the brainmaps themselves can be valuable tools for diagnosis, the discriminant databases are designed specifically for this purpose. The NX Link database is stored with brianwave norms for various symptoms and disorders; they compare the patient's data to each norm to determine whether the disorder is a possibility or not. For example, the NX Link may determine, after analyzing the EEG, that a patient may have Attention Deficit Disorder because their brainmaps bear similarities to those of an individual with a common case of ADD. 

After assessing which symptoms/disorders are probably causing the problems (using brainmaps), I run the patient's file through each discriminant by testing them for each symptom. The system then prints the likeliness of the patient having/developing that disorder. While not being absolutely accurate, the discriminant tool of the NX Link is invaluable for diagnosis.


Tuesday, March 17, 2015

(Week 4 Update) Neurofeedback Databases: Neurorep

While I have still been setting up patients and training them myself, this week has been dedicated to creating QEEG reports. I was taught how to run a patient's test file, containing the raw EEG without any analysis, through a database. I was exposed to only the Neurorep database, but the ADD Clinic uses a total of four databases for each patients data. Below are the various databases. I have presented them in the following format.

Name: Name of Database
Developer: Dr./Social worker who compiled the data.
Affiliated With: The research agency who funded/endorsed the collection of all the data.
Recording Condition: Whether the database is for eyes closed or eyes open training.
Discriminant Analyses: Some databases will contain discriminants for various mental disorders, meaning they will have both norms and different subtypes for that disorder. For example, the NYU Database has discriminants for ADHD, which means that the database can identify the many ways ADHD can manifest itself in the brains of different individuals (high Beta or low Delta/Theta, etc.)  These databases are considered the most accurate.Other databases contain only norm (without mental disorder) files.
Number of Subjects: Number of people/files mapped and recorded in the database.
Age Range: Range of ages of people tested for that database. This is important because, ethically, a qEEG practitioner cannot run a client's file through a certain database if the client's age is not within the age range.
Other Notes: Any other important information.

The following databases are used by ADD Clinic to pinpoint areas of deficiency. I have also included examples of diagrams from each database's qEEG because each one displays results differently. For example, Neurorep may use the color green to display 0 standard deviations from the norm, and may only display up to 3 standard deviations. NX Link, on the other hand, may use black to display 0 standard deviations from the norm, and may display up to 1.5 standard deviations.

NX Link
Developer: John and Princhep
Affiliated With: New York University Medical School
Recording Condition: Eyes Closed
Discriminant Analyses: Head Injury, Depression, Delusions & Hallucinations, ADHD, Learning Disabilities, Memory, Substance & Alcohol Abuse
Number of Subjects: 782
Age Range: 6 yrs - 90 yrs
Other Information: This is perhaps the most extensive database for neurofeedback. The NYU Medical School tested 782 New Yorkers and mapped all the subtypes of the disorders listed above. Other countries (Japan, Korea, Nigeria, etc.) have ran their own citizens through the database and it has always been nearly 100% accurate at identifying mental disorders.

Neuroguide Lifespan Database
Developer: Dr. R. Thatcher
Affiliated With: Applied Neuroscience Inc.
Recording Condition: Eyes Closed & Eyes Open
Discriminant Analyses: Traumatic Brain Injury, Learning Disabilities
Number of Subjects: 625
Age Range: 2 months - 82 yrs

Neurorep
Developer: W. Hudspeth
Affiliated With: Brain Labs
Recording Condition: Eyes Closed & Eyes Open
Discriminant Analyses: Norms Only
Number of Subjects: 55 + 30 replicates
Age Range: 18 yrs - 59 yrs

Eureka LORETA
Developer: Sherlin and Congedo
Affiliated With: Nova Tech EEG
Recording Condition: Eyes Closed
Discriminant Analyses: Normalized Relative Current Source Density.
Number of Subjects: 84
Age Range: 18 yrs - 35 yrs
Other Information: This database is unlike any of the others; it pinpoints the brain's problem area on an x, y, and z axis, allowing a specific 3D area of the brain to be targeted. It produces 3 images, a horizontal slice of the brain, a vertical one, and an aerial view to show the problem in all dimensions.

Guide to Neurorep:

As I stated earlier, so far, I have only worked with the Neurorep program. So I will now detail the various aspects of the Neurorep database. The program itself is DOS based, with a very simple, keyboard-controlled system. When I run the files through the program, there are many "tests" (or interpretations) I have to perform. Keep in mind, each test/qEEG report creation is performed for both the Eyes Closed file and the Eyes Open one. The Neurorep database contains different norms for both EC and EO for all age brackets.

Analysis: A series of z-score database-created images that compares the brainwaves of the client to the normal brainwaves of others in their age group and gender.
Spectrum Report: A non-database (It uses only other references from the client's brain) graph that shows at which frequencies (9 Hz, 10 Hz, etc) occurs the most power/amplitude of the brainwaves. It shows an excess of power, which can help determine where the problem is.
Weighted Report: A non-database series of images that compares the power of brainwaves in a certain region of the brain to the powers of brainwaves in the surrounding regions. This will display any relative abnormalities.
NEI Image Creation: A series of non-database images that measures the connectivity between different regions of the brain. It measures if the brain is over connected (overly-excited connection between parts) or very disconnected (slow transfer of information), such as after a brain injury.

Each action creates a series of files/images, that are unreadable without Neurofeedback programs. So, using a program call L-Link, I convert each file and combine them into a single PDF file. The compilation of all completed PDF files from each database is the completed qEEG report.

Database References

Since I will include many examples of qEEG reports in my next post, here is a brief guide to interpreting them. This is a very simplified version, and I will upload the more detailed one in the future. But before even attempting to understand the report, we must discuss common statistic terminology.

Database: Organized collection of data (in this case, brain maps)

Z-score Tables: Tables of data which indicates how many standard deviations an element is away from the mean. Brain map z-scores will display how far away the client's brainwave amplitudes are away from the normal.

Standard Deviation: A measure used to quantify the amount of variation between different elements in a data set. Concerning brain mapping, standard deviations away from the norm will reveal the severity of the problem; more standard deviations away indicates a more severe problem. 

 Interpreting the qEEG - Introduction

My next post will be about the databases used to create qEEG. Each database contains files for "normal brains" in each age bracket. Some also contain norms, or the various forms, of different mental disorders, which allows for a more accurate diagnosis. By running a client's data through the norm database, we can determine how much brainwave deviation there is. The file is converted into a series of colored aerial diagrams of a head. Each different color represents a certain number of standard deviations in the brainwave amplitudes in a particular region. Let's look at some examples. Below is an excerpt from a qEEG that has ran a client's file through the Neuroguide database.


If the patient's brainwave levels were normal, the aerial view would be completely green (0 standard deviations have been deemed green by the spectrum below the diagram). However, the client seems to have Delta levels 6 standard deviations below the norm (dark blue), which may cause anxiety, nervousness, or insomnia. On the other hand, their Theta levels seem to be relatively normal, with only up to 1.5 standard deviations away from the norm in the right-frontal lobe. Running a patient's raw EEG (literally just brainwaves) through the database will help diagnose their mental disorder. Without the qEEG reports, the area of deficiency/type of disorder would not be known, which would lead to very inefficient neurofeedback training.

Tuesday, March 10, 2015

The Brodmann Areas

Created by German anatomist Korbinian Brodmann, the Brodmann Areas separate the brain into regions with similar cytoarchitecture (layering of neural tissue). Previously a psychiatric physician, Brodmann was introduced to the field of theoretical neuroscience research by Alois Alzheimer, who first identified Alzheimer's disease. Brodmann worked with the University of Berlin's Neurological Library to write his 1909 thesis on regions of different neural layering (which would later be named Brodmann areas). He employed the glial staining technique -- glial fibers are made visible with crystal violet and made resistant to decolorization with alkaline aniline-chloroformmixture. These glial fibers are non-neuronal cells, which are to hold neurons in place and supply them oxygen (the glue of the nervous system). By staining these cells, Brodmann was able to observe neural tissue density under a light microscope. After finding that the tissue density varied greatly even within the same brain, he grouped the brain's regions in accordance with his data. These are now known as the Brodmann Areas.

The divisions of the brain correspond with particular body functions. Even though we previously discussed the purposes of brain lobes, different parts of each brain lobe are in charge of different functions. For example, the frontal lobe controls all forms of executive action. But certain areas of the frontal lobe specialize in different forms of executive action: the primary motor cortex controls basic movement while the outer prefrontal lobe controls judgement abilities.

Brodmann Areas and Functions

There are 52 total Brodmann areas, which have been grouped into 11 areas with similar cytoarchitecture. Below are Korbinian Brodmann's actual diagrams of the brain.
Lateral Surface:Side Surface of Brain

Medial Surface:Middle Slice of Brain
Primary Somatosensory Cortex (Areas 1, 2, 3): Primary receptive area for touch sensations.
Primary Motor Cortex (Area 4): Communicates with spinal cord to coordinate large muscle movements.
Primary Visual Cortex (Area 17): Processes visual information, such as visual stimuli and object recognition.
Primary Auditory Cortex (Area 22): Processes auditory information, such as source of sound identification, sound recognition, and frequency recognition.
Wernicke's Area (Areas 39, 40): Produces written and spoken language, and is one of two linked speech areas in the brain (linked with Broca's Area)
Broca's Area (Areas 44, 45): Associated with more complex language production, such as inferences, complex sentences, sarcasm, etc.

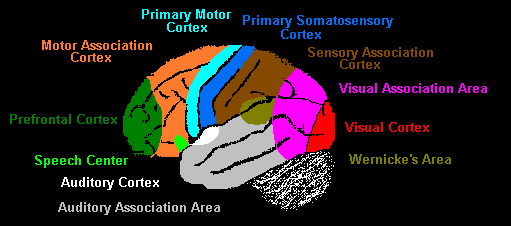
The most important (for this project) Brodmann areas have been labeled. While these areas provide more detailed insight into the functions of each brain area, for the purposes of this project, I will use a simpler diagram. 

Previously unidentified areas in the diagram above are explained below. Please refer to the previous set of definitions as well.

Auditory Association Area: Processes auditory signals so they can be interpreted in context.
Speech Center: see Broca's Area
Pre-frontal Cortex: Coordinates concentration, judgement, and problem-solving abilities.
Motor Association Cortex: Coordinates more complex and fine movements
Sensory Association Cortex: Processes multisensory information and associated them together and in context.
Visual Association Cortex: Processes visual information and associates them with memory.

Importance - Diagnosis

So what is so important about the Brodmann Areas? An understanding of the regions and their associated functions is essential to treating mental disorders. If the QEEG reports abnormalities in portions of the brain, those functions are likely to be affected as well. Excess/lack of brainwaves in those regions will either speed up or slow down associated functions of that region. For example, if excess Theta is found in the frontal lobes, a client will not be attentive or concentrated. Therefore, the client is likely to have Attention Deficit Disorder. Any noticeable behavioral problems in a client will allow a therapist to pinpoint a Brodmann area of disorder. This will result in faster detection of problems, more effective treatment specific to that problem, and an understanding of the physical problems of the client's brain.

Friday, March 6, 2015

The 10/20 System

The 10/20 Locations
As I mentioned before, in neurofeedback, electrodes are placed on the scalp according to the internationally recognized 10/20 system. The name stems from the fact that all electrode placements are either 10% or 20% of the entire across-head distance away from each other. The placements of each electrode are chosen based on the underlying portion of cerebral cortex (the outer covering of the brain.) Below is a diagram of the cerebral cortex, which is divided into four lobes.

Frontal Lobe: associated with thinking, motor skills, and reasoning.
Parietal Lobe: associated with tactile sensory information (pressure, touch, pain), and processing of senses.
Temporal Lobe: associated with memory formation, sound/speech interpretation, and memory recall.
Occipital Lobe: associated with receiving and processing visual information from the eyes, as well as visual recognition of objects and colors.

These locations correspond with the first letter in all the 10/20 locations because they lie right underneath where the electrode is placed. Below is a map of the locations on the scalp. It is an aerial view of a person's head. In this case, the person is facing upwards (triangle = nose, ovals = ears)
 
As seen above, each electrode is placed 10% or 20% away from the next electrode (either vertically or horizontally). The name of each electrode begins with the first letter of the underlying lobe of the cerebral cortex. For example, P4 lies above the parietal lobe. The only exception is the Center (horizontal axis of symmetry over head). The second letter of the name is added based on where the electrode is placed on the head as a whole. Z is added if the electrode is on the head's vertical line of symmetry. Even numbers are added if the electrode is on the right hemisphere; odd numbers are added if the electrode is on the left hemisphere.

Here are some examples: 
Electrode C4: It must be placed on the horizontal axis of symmetry over the head, in the right hemisphere, and must be 20% away from Cz (the exact center of the head).
Electrode P3: It must be placed over the parietal lobes, in the left hemisphere, and 20% away from Pz (the location above the parietal lobe and on the vertical axis of symmetry of the head).

Using other locations as references, we can determine the harder, more difficult locations, like O2. Despite seeming like an inaccurate system, there is room for error. One has approximately a dime's area of error space around each location to place the electrode.

But why are these electrode locations even necessary? Even though the purpose of neurofeedback is to train all the brain's waves to the proper levels, certain problems will be located in specific areas of the brain. For example, a typical case of ADD will have excessive Theta amplitudes in the Frontal lobes (F locations). This slows the task-performing region of the brain, causing distractedness. 
Brainmap of ADD: The Z-score table on the left indicates that the child's Theta frequencies are 5+ standard deviations away from normal frequencies. I will later post how to read brainmaps and use them to diagnose mental disorders.
To treat this case of ADD, one must downtrain Theta waves in specifically those regions. Therefore, the electrode locations allow neurofeedback therapists to treat the problem area which is associated with the client's specific disorder. It minimizes training time and solves the problem effectively. In single channel, the main electrode is placed on a single electrode locations. In 19-channel neurofeedback, the electrode cap covers all 19 locations on the head, allowing analysis of all regions of the brain simultaneously. As a result, 19-channel is used for far more complex/intricate issues with a variety of indicators. A simultaneous view of all brainwave activity in every region of the brain allows for a better wholesome understanding of the patient's problem.

In a future post, I will discuss common mental problems and their associated brainwave patterns/defective brain regions.